{Ed. Note: The average person doesn't give much thought to the subject of AIDS among prison inmates, but as the number of American convicts grows exponentially -- so does the problem of AIDS in prison. Each year approximately 1,000 convicts die from AIDS. Even more alarming is the fact that the number of female convicts testing positive for HIV has been growing at an alarming rate: 88% from 1991 through 1995, while the rate for male convicts rose only 28.1% during that same period. The following Bureau of Justice Statistics report deals in depth with this topic.}
by Laura Maruschak
BJS Statistician
Bureau of Justice Statistics 1995
************
Highlights
************
HIV-positive State and
Federal prison inmates
-------------------------
Year | Number | Percent of population
------------------------------------------
1991 17,551 2.2%
1992 20,651 2.5
1993 21,475 2.4
1994 22,717 2.4
1995 24,226 2.3
Between 1991 and 1995 the number of HIV-positive prisoners grew
at about the same rate (38%) as the overall prison population (36%).
At yearend 1995, 4.0% of all female State prison inmates were
HIV positive, compared to 2.3% of male State prisoners.
HIV-positive prison inmates
----------------------------
Percent
of custody
Jurisdiction Number population
--------------------------------------------
New York 9,500 13.9%
Florida 2,193 3.4
Texas 1,890 1.5
California 1,042 .8
New Jersey 847 3.7
Georgia 828 2.4
Federal system 822 .9
Connecticut 755 5.1
Maryland 724 3.4
Based on jurisdictions with more than 700 HIV-positive inmates.
*New York held more than a third of all inmates (9,500 inmates)
known to be HIV positive at yearend 1995.
*Of all HIV-positive prison inmates, 21% were confirmed AIDS
cases.
In State prisons, 21% of HIV-positive inmates had AIDS; in
Federal prisons, 16%.
*The overall rate of confirmed AIDS among the Nation's prison
population (0.51%) was more than 6 times the rate in the U.S.
population (0.08%).
Inmates in local jails, who have been tested for HIV, report
similar HIV-infection rates:
Tested jail inmates
who reported results
---------------------
Percent
Number HIV positive
-------- --------------
All inmate 289,991 2.2%
Male 258,019 2.1
Female 31,972 2.4
White 110,023 1.4%
Black 125,259 2.6
Hispanic 45,759 3.2
Age 24 or
younger 81,228 .7%
25-34 116,532 2.1
35-44 70,776 3.8
45 or older 21,455 3.0
From the 1995-96 Survey of Inmates in Local Jails.
*Jail officials in the last national Census of Jails (conducted
in 1993) reported that 6,711 inmates were known to be HIV
positive and 1,888 had confirmed AIDS. The infection rate was
highest in the largest jail jurisdictions.
At yearend 1995, 2.3% of all State and Federal prison inmates
were reported by prison authorities to be infected with the
human immunodeficiency virus (HIV). In State prisons 23,404
inmates were HIV positive (2.4% of the total), and in Federal
prisons, 822 (0.9%). Of all inmates in U.S. prisons, 5,099
prisoners (0.5%) had confirmed AIDS, and 18,165 prisoners were
HIV positive without having confirmed AIDS.
In 1995, 1,010 State inmates died of AIDS-related causes, up
from 955 in 1994. For every 100,000 State inmates in 1995, 100
died of AIDS-related causes. Between 1991 and 1995 about 1 in 3 inmate deaths were attributable to AIDS-related causes.
Based on personal interviews conducted from October 1995 through March 1996 in the Survey of Inmates in Local Jails, almost 6 in 10 jail inmates reported ever being tested for HIV. Of those tested, 2.2% reported being HIV positive. Among female inmates, 2.4% said they were HIV positive; among male inmates, 2.1%. An estimated 1.6% of tested jail inmates who said they never used drugs were HIV positive, as were 2.3% who ever used drugs, 3.0% who used drugs in the month before arrest, 4.0% who used needles to inject drugs, and 6.3% who shared needles.
****************************************
Trends in HIV infection in U.S. prisons
****************************************
At yearend 1995, 24,226 inmates in State and Federal prisons
were known to be infected with the human immunodeficiency virus
(HIV). In 1993, 20,516 State prisoners were HIV positive; in 1995,
23,404 were HIV positive, a 14% increase. The Federal Bureau of
Prisons held 959 HIV-positive inmates in 1993 and 822 in 1995,
a 14% decrease.
****************************************
Table 1. Inmates in custody of State or Federal prison authorities and known to be positive for the human immunodeficiency virus, 1993-95
Total known to be HIV/AIDS cases as a percent
HIV positive of total custody population/a
----------------------- ------------------------------
Jurisdiction 1993 1994 1995 1993 1994 1995
---------------------------------------------------------------------------
U.S. total/b 21475 22717 24226 2.4 2.4 2.3
Federal 959 964 822 1.2 1.1 0.9
State 20516 21753 23404 2.6 2.5 2.4
Northeast 10690 11001 12262 7.5 7.4 7.8
Connecticut 886 940 755 6.6 6.6 5.1
Maine 8 8 4 0.6 0.5 0.3
Massachusetts 394 388 409 3.9 3.4 3.9
New Hampshire 17 26 31 0.9 1.3 1.5
New Jersey 881 770 847 4.4 3.6 3.7
New York 8000 8295 9500 12.4 12.4 13.9
Pennsylvania 409 461 590 1.6 1.6 1.8
Rhode Island 89 113 126 3.4 3.8 4.4
Vermont 6 0 0 0.5 0 0
Midwest 1671 1750 1667 1.1 1.1 0.9
Illinois 591 600 583 1.7 1.6 1.5
Indiana -- -- -- -- -- --
Iowa 11 25 20 0.2 0.5 0.3
Kansas 39 20 24 0.7 0.3 0.3
Michigan 434 384 379 1.1 0.9 0.9
Minnesota 30 35 46 0.7 0.8 1
Missouri 136 146 173 0.8 0.8 0.9
Nebraska 17 16 19 0.7 0.6 0.6
North Dakota 2 3 2 0.3 0.5 0.3
Ohio 355 454 346 0.9 1.1 0.8
South Dakota -- 2 3 -- 0.1 0.2
Wisconsin 56 65 72 0.6 0.6 0.6
South 6657 7410 7840 2.1 2 1.9
Alabama 194 210 222 1.1 1.1 1.1
Arkansas 80 81 83 1 1 1
Delaware 113 34 122 2.7 0.8 2.5
District of
Columbia -- -- -- -- -- --
Florida 1780 1986 2193 3.4 3.5 3.4
Georgia 745 854 828 2.7 2.6 2.4
Kentucky 42 44 41 0.5 0.5 0.4
Louisiana 262 285 314 1.6 1.8 1.8
Maryland 769 774 724 3.8 3.7 3.4
Mississippi 118 119 138 1.4 1.2 1.4
North Carolina 485 521 526 2.2 2.2 1.9
Oklahoma 102 102 115 0.8 0.8 0.8
South Carolina 452 434 380 2.7 2.5 2
Tennessee 88 89 120 0.8 0.7 0.9
Texas 1212 1584 1890 1.7 1.6 1.5
Virginia 207 285 134 1.1 1.4 0.6
West Virginia 8 8 10 0.4 0.4 0.4
West 1498 1592 1635 0.8 0.8 0.8
Alaska -- -- 5 -- -- 0.2
Arizona 89 143 140 0.5 0.7 0.7
California 1048 1055 1042 0.9 0.8 0.8
Colorado 74 79 93 0.8 0.9 1
Hawaii 21 14 12 0.7 0.5 0.4
Idaho 26 20 11 1 0.8 0.4
Montana 5 7 4 0.3 0.4 0.2
Nevada 100 122 147 1.6 1.8 1.9
New Mexico 11 19 24 0.3 0.5 0.6
Oregon 29 24 29 0.4 0.3 0.4
Utah 26 48 31 0.9 1.5 0.8
Washington 63 55 92 0.6 0.5 0.8
Wyoming 6 6 5 0.5 0.6 0.4
-----------------------------------------------------------------
--Not reported.
/aThe custody population includes only those
inmates housed in a jurisdiction's facilities.
/bTotals exclude those inmates in jurisdictions that
did not report data on HIV/AIDS.
*********************************************
Between 1991 and 1995 the number of HIV-positive inmates grew at about the same rate as the overall prison population (38% compared to 36%). HIV-positive inmates comprised 2.3% of the State prison population in 1991 and 2.4% in 1995. In Federal prisons, HIV-positive inmates were 1.0% of all prisoners in 1991 and 0.9% in 1995.
*********************************************
Percent of custody population known to be HIV-positive
-------------------------------
Year State Federal
--------------------------------------
1991 2.3% 1.0%
1992 2.6 1.2
1993 2.6 1.2
1994 2.5 1.1
1995 2.4 .9
******************************************
HIV-infected inmates are concentrated in a small number of
States. New York and Florida house the largest number of
HIV-positive inmates. In 1995 these two States held a little
less than half of all HIV-positive inmates in the Nation. New
York had the highest percentage of inmates known to be HIV
positive (13.9%), followed by Connecticut (5.1%), Rhode Island (4.4%), Massachusetts (3.9%), and New Jersey (3.7%).
Eight States reported having 10 or fewer cases of HIV-positive
inmates in their prisons. Vermont reported no HIV-positive
inmates. Twenty-seven States reported that fewer than 1.0% of
their inmate population were HIV positive.
New York reported the largest growth in the number of
HIV-positive inmates, from 8,000 in 1993 to 9,500 in 1995.
Substantial increases were also reported in Texas (an increase
of 678 inmates) and Florida (413).
**********************
Confirmed AIDS cases
in U.S. prisons
**********************
At the end of 1995, 5,099 confirmed AIDS cases were in U.S.
prisons--4,965 State inmates and 134 Federal inmates.
Of the remaining HIV-positive inmates, 3,058 showed symptoms of HIV infection and 15,107 were asymptomatic.
*******************************************
Table 2. Inmates in custody of State and Federal prison authorities, by type of HIV infection or confirmed AIDS, yearend 1995
Confirmed AIDS case
Cases of HIV or confirmed AIDS as a percent of --
-------------------------------- ----------------------
Asympto- Sympto- Confirmed Total HIV Custody
Jurisdiction Total/a matic/b matic/c AIDS cases populatio
--------------------------------------------------------------------------------
U.S. total 24226 15107 3058 5099 21 0.5
Federal 822 118 570 134 16.3 0.1
State 23404 14989 2488 4965 21.2 0.5
Northeast 12262 9227 917 2118 17.3 1.4
Connecticut 755 254 314 187 24.8 1.3
Maine 4 0 0 4 ** 0.3
Massachusetts 409 94 155 160 39.1 1.5
New Hampshire 31 10 7 14 45.2 0.7
New Jersey 847 504 -- 343 40.5 1.5
New York 9500 8019 299 1182 12.4 1.7
Pennsylvania 590 337 67 186 31.5 0.6
Rhode Island 126 9 75 42 33.3 1.5
Vermont 0 0 0 0 **
Midwest 1667 1020 233 414 24.8 0.2
Illinois 583 351 55 177 30.4 0.5
Indiana -- -- -- -- -- --
Iowa 20 15 -- 5 25 0.1
Kansas 24 18 0 6 25 0.1
Michigan 379 272 -- 107 28.2 0.3
Minnesota 46 34 6 6 13 0.1
Missouri 173 -- 158 15 8.7 0.1
Nebraska 19 12 -- 7 36.8 0.2
North Dakota 2 1 0 1 ** 0.1
Ohio 346 270 -- 76 22 0.2
South Dakota 3 0 0 3 ** 0.2
Wisconsin 72 47 14 11 15.3 0.1
South 7840 3810 1138 1930 24.6 0.5
Alabama 222 180 -- 42 18.9 0.2
Arkansas 83 40 20 23 27.7 0.3
Delaware 122 80 -- 42 34.4 0.9
District of Columbia -- -- -- -- -- --
Florida 2193 1501 -- 692 31.6 1.1
Georgiaa 828 -- -- -- -- --
Kentucky 41 29 0 12 29.3 0.1
Louisiana 314 -- 228 86 27.4 0.5
Maryland 724 362 104 258 35.6 1.2
Mississippi 138 110 -- 28 20.3 0.3
North Carolina 526 -- 397 129 24.5 0.5
Oklahoma 115 107 -- 8 7 0.1
South Carolina 380 299 -- 81 21.3 0.4
Tennessee 120 -- 86 34 28.3 0.3
Texas 1890 1092 303 495 26.2 0.4
Virginiaa 134 -- -- -- -- --
West Virginia 10 10 0 0 ** 0
West 1635 932 200 503 30.8 0.2
Alaska 5 0 0 5 ** 0.2
Arizona 140 125 -- 15 10.7 0.1
California 1042 577 80 385 36.9 0.3
Colorado 93 28 46 19 20.4 0.2
Hawaii 12 11 0 1 8.3 ***
Idaho 11 6 0 5 45.5 0.2
Montana 4 4 0 0 ** 0
Nevada 147 90 27 30 20.4 0.4
New Mexico 24 22 0 2 8.3 ***
Oregon 29 11 11 7 24.1 0.1
Utah 31 21 4 6 19.4 0.2
Washington 92 36 28 28 30.4 0.2
Wyoming 5 1 4 0 ** 0
---------------------------------------------------------------------------------
Note: Totals and percentages exclude inmates in jurisdictions that did not report of HIV/AIDS infection. The custody population includes only inmates housed at the end of 1995.
--Not reported.
**Not calculated for fewer than 10 cases.
***Less than 0.05%.
/aGeorgia and Virginia reported the total of HIV-positive cases but not the stage of HIV infection.
/bIncludes inmates who tested positive for the HIV antibody but had no HIV-relate
symptoms.
/cIncludes inmates with symptoms of HIV infection but without a confirmed AIDS
diagnois.
**********************************************
The number of prison inmates with confirmed AIDS more than
tripled after 1991. The number of inmates with lesser or no
symptoms of HIV infection grew by 15%.
*****************************************
Year | confirmed AIDS cases | HIV Positive
----------------------------------------
1991 1,682 15,797
1992 2,644 18,087
1993 3,765 17,773
1994 4,849 17,864
1995 5,099 18,165
----------------------------------------
Note: Care should be exercised when comparing the number of
reported cases over time. In January 1993 the Centers for
Disease Control and Prevention revised the HIV classification
system and expanded the surveillance case definition for AIDS to include specific CD4+ T-lymphocyte criteria and three additional clinical conditions--pulmonary tuberculosis, recurrent pneumonia, and invasive cervical cancer. This expansion resulted in a substantial increase in the number of reported AIDS cases during 1993.
*******************************************
The States with the largest number of confirmed AIDS cases were New York (1,182), Florida (692), and Texas (495), which accounted for 48% of all confirmed AIDS cases in State prisons.
Eighteen States reported having fewer than 10 inmates with confirmed AIDS in their prison systems. Confirmed AIDS cases comprised a half of one percent of all inmates in State and Federal prisons. Of those HIV-positive inmates in prison,about a fifth were confirmed AIDS cases.
As a percentage of the total prison population in each State, the highest number of confirmed AIDS cases was in New York (1.7% of inmates in the State), followed by Massachusetts, New Jersey, and Rhode Island (each 1.5%). In 16 States, confirmed AIDS cases comprised 0.1% or less of State inmates.
******************************************
Comparison to the U.S. resident population
******************************************
At the end of 1995, the rate of confirmed AIDS in State and
Federal prisons was more than 6 times higher than in the total
U.S. population. Approximately 0.51% of all prisoners had
confirmed AIDS, compared to 0.08 of the population.
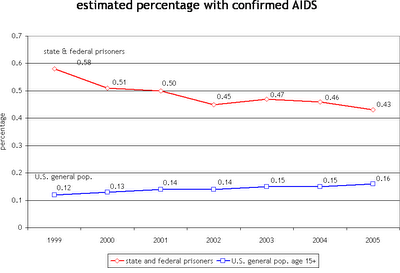
******************************************
Percent of population with confirmed AIDS
--------------------------------
Year | Populaltion | State Prisons
----------------------------------------
1991 0.03% 0.21%
1992 0.03 0.33
1993 0.06 0.50
1994 0.07 0.52
1995 0.08 0.51
-----------------------------------------
Note: The percent of the general population with confirmed AIDS in each year may be overestimated due to delays in death reports. Care should be exercised when comparing percentages over time, because of changes in the case definition for AIDS.
*******************************************
In every year after 1991 the rate of confirmed AIDS was
significantly higher among prison inmates than
in the general population. In 1992 the rate of AIDS was nearly
10 times higher for prisoners than the general population. In
1993, following a revision of the HIV classification system and
an expansion of the case definition for AIDS, the rate of
confirmed AIDS increased 1 1/2 times among prisoners and doubled in
the general population. After the adoption of these new
measures, the incidence of AIDS grew somewhat faster in the
general population (from 0.06% in 1993 to 0.08% in 1995) than in
prison (from 0.50% to 0.51%). At yearend 1995, the rate of
confirmed AIDS was over 6 times higher in prisons than in the
general population.
**************************************
AIDS-related deaths in State prisons
**************************************
In 1995, 1,010 State inmates died of Pneumocystis carinii
pneumonia, Kaposi's sarcoma, or other AIDS-related diseases.
These AIDS-related deaths comprised about a third of
all deaths of State prisoners.
*********************************************
AIDS-related deaths as a percent of all deaths
---------------------------------
Year
U.S. general population
State prison age 15-54 * inmates
-------------------------------------------
1991 10.4% 28.0%
1992 11.7 35.2
1993 11.9 33.2
1994 12.7 35.1
1995 -- 34.2
*******************************************
Number of inmate deaths in State prisons, by cause, 1993-95
Total number with rate per 100,000
1993 1994 1995
Total 2477 290 2878 314 3133 311
Illness/natural causes 1188 139 1393 152 1569 156
AIDS 761 89 955 104 1010 100
Suicide 145 17 155 17 160 16
Accident 38 4 33 4 48 5
Execution 37 4 30 3 56 5
By another person 84 10 68 7 86 9
Other/unspecified 224 26 244 27 204 20
----------------------------------------------------------------------------
Note: In each year some States did not report complete data on cause of death.
To calculate the rate of death, the number of inmates under State jurisdiction on June 30 of each year was used as an approximation of the average population exposed to the risk of death during the year. Inmates in States that did not report data on inmate deaths were excluded in 1993 and 1994. All States reported data on inmate deaths in 1995.
****************************************
The rate of death because of AIDS is about 3 times higher in the prison population than in the total U.S. population age 15 to 54. Between 1991 and 1995 about 1 in every 3 prisoner deaths were attributable to AIDS-related causes, compared to about 1 in 10 deaths in the general population.
From 1991 to 1995 "AIDS-related causes" was the second leading cause of death for State prisoners behind "illness and natural causes." For every 100,000 State inmates in 1995, 109 died of AIDS-related causes. The number of AIDS-related deaths in prison increased 94% from 1991 to 1995.
****************************************
Table 4. AIDS-related deaths of sentenced prisoners
under State jurisdiction, 1995 Deaths from all causes
in State prisons AIDS-related deaths
--------------------- --------------------------------
Rate per Rate per As a
100,000 100,000 percent of
---------------------------------------------------------------------------
Total 3133 311 1010 109 34.2%
Northeast 740 468 402 254 54.3
Connecticut 42 280 24 160 57.1
Maine 0 0 0 0 **
Massachusetts 34 296 14 122 41.2
New Hampshire 2 97 2 97 **
New Jersey 137 535 66 258 48.2
New York 396 578 258 376 65.2
Pennsylvania 122 409 38 127 31.1
Rhode Island 7 223 0 0 **
Vermont 0 0 0 0 **
Midwest 481 252 63 42 16.7
Illinois 103 273 31 82 30.1
Indiana 44 280 1 6 2.3
Iowa 9 158 0 0 **
Kansas 13 188 0 0 **
Michigan 104 251 -- -- --
Minnesota 9 189 1 21 **
Missouri 53 280 4 21 7.5
Nebraska 13 464 0 0 0
North Dakota 1 164 0 0 **
Ohio 114 262 23 53 20.2
South Dakota 5 275 0 0 **
Wisconsin 13 122 3 28 23.1
South 1455 325 432 105 31.3
Alabama 88 438 20 100 22.7
Arkansas 26 286 1 11 3.8
Delaware 9 194 0 0 **
District of
Columbia 7 67 -- -- --
Florida 254 410 150 242 59.1
Georgia 127 372 50 147 39.4
Kentucky 29 243 2 17 6.9
Louisiana 68 270 -- -- --
Maryland 54 252 25 117 46.3
Mississippi 42 337 5 40 11.9
North Carolina 69 257 28 104 40.6
Oklahoma 66 375 4 23 6.1
South Carolina 63 323 34 175 54
Tennessee 64 429 12 80 18.8
Texas 399 314 74 58 18.5
Virginia 83 304 27 99 32.5
West Virginia 7 287 0 0 **
West 457 217 113 54 24.7
Alaska 5 154 0 0 **
Arizona 58 277 0 0 0
California 262 199 91 69 34.7
Colorado 25 232 6 56 24
Hawaii 11 307 1 28 9.1
Idaho 1 31 0 0 **
Montana 11 581 0 0 0
Nevada 25 334 6 80 24
New Mexico 8 194 0 0 **
Oregon 21 280 5 67 23.8
Utah 6 183 0 0 **
Washington 23 202 4 35 17.4
Wyoming 1 76 0 0 **
-------------------------------------------------------------------------
--Not reported.
**Not calculated for fewer than 10 deaths.
/aBased on the number of inmates under State jurisdiction on June 30, 1995.
/bNational and regional totals exclude inmates in jurisdictions that did not
report data on cause of death.
*****************************************
In 1995 AIDS-related causes accounted for over half of all
inmate deaths in New York (65%), Florida (59%), Connecticut
(57%), and South Carolina (54%). Seventeen States reported
having no AIDS-related deaths, and 4 States reported only 1
AIDS-related death.
*********************************
HIV infection of male and female
State inmates
*********************************
At the end of 1995, there were 20,690 male and 2,182 female State inmates infected with HIV--2.3% of all male and 4.0% of all female State inmates. The rate of HIV infection was higher for women than men in every region and in most States.
Table 5. State prison inmates known to be positive for the human immunodeficiency virus, by sex, yearend 1995
Male HIV cases Female HIV cases
--------------- ------------------
Percent of Percent of
Jurisdiction Number population Number population
--------------------------------------------------------------------
Total 20690 2.3 2182 4
Northeast 11080 7.5 1182 14.7
Connecticut 627 4.6 128 13.4
Maine 4 0.3 0 0
Massachusetts 340 3.5 69 10.5
New Hampshire 17 0.9 14 11.4
New Jersey 748 3.4 99 9.8
New York 8678 13.4 822 22.7
Pennsylvania 561 1.8 29 2
Rhode Island 105 3.9 21 14.5
Vermont 0 0 0 0
Midwest 1553 0.9 114 1.2
Illinois 528 1.5 55 2.5
Indiana -- -- -- --
Iowa 18 0.3 2 0.5
Kansas 24 0.4 0 0
Michigan 364 0.9 15 0.8
Minnesota 41 0.9 5 2.5
Missouri 164 0.9 9 0.8
Nebraska 19 0.7 0 0
North Dakota 1 0.2 1 2.7
Ohio 324 0.8 22 0.8
South Dakota 3 0.2 0 0
Wisconsin 67 0.6 5 1
South 6598 1.8 740 3.2
Alabama 209 1.1 13 1
Arkansas 79 1 4 0.7
Delaware -- -- -- --
District of Columbia -- -- -- --
Florida 1971 3.3 222 6.1
Georgia 747 2.3 81 4
Kentucky 40 0.4 1 0.2
Louisiana 299 1.8 15 2.4
Maryland 665 3.3 59 5.5
Mississippi 136 1.4 2 0.3
North Carolina 437 1.7 89 5.3
Oklahoma 105 0.8 10 0.8
South Carolina -- -- -- --
Tennessee 118 0.9 2 0.5
Texas 1648 1.4 242 3
Virginia 134 0.6 0 0
West Virginia 10 0.4 0 0
West 1459 0.7 146 1
Alaska 5 0.2 0 0
Arizona 128 0.6 12 0.8
California 957 0.8 85 0.9
Colorado 87 1 6 0.8
Hawaii 12 0.5 0 0
Idaho 11 0.4 0 0
Montana 4 0.3 0 0
Nevada 93 1.3 24 4.6
New Mexico 23 0.6 1 0.3
Oregon 25 0.3 4 0.9
Utah 29 0.8 2 0.9
Washington 81 0.7 11 1.4
Wyoming 4 0.3 1 1.1
--------------------------------------------------------------------------
Note: The sex of inmates was not reported for 502 HIV cases.
Totals exclude inmates in jurisdictions that did not report
data on HIV/AIDS or sex of inmates.
****************************************
From 1991 to 1995 the number of male State inmates infected with HIV increased 28%, while the number of female inmates infected increased at a much faster rate--88%. --------------------------------------------
Male
1991 16,150 2.2%
1992 18,266 2.6
1993 18,218 2.5
1994 19,762 2.4
1995 20,690 2.3
Percent change, 1991-95* 28.1%
Females
1991 1,159 3.0%
1992 1,598 4.0
1993 1,796 4.2
1994 1,953 3.9
1995 2,182 4.0
Percent change, 1991-95* 88.3%
--------------------------------------------
Note: Includes State inmates only.
*In 1991 North Carolina, South Dakota, and the District of
Columbia did not report data by sex. In 1995 Delaware, Indiana,
South Carolina, and the District of Columbia did not report data
by sex. In 1995 delaware. Indiana, South Carolina, and the District
of Columbia did not report data by sex
********************************************
In five States, all in the Northeast, more than 10% of female
inmates were known to be HIV positive--New York (22.7%), Rhode
Island (14.5%), Connecticut (13.4%), New Hampshire (11.4%), and
Massachusetts (10.5%). New York (13.4%) was the only State in
which more than 10% of the male inmates were known to be
infected with HIV.
*********************
HIV-testing policies
*********************
Each State, the District of Columbia, and the Federal Bureau of Prisons test their inmates for HIV based on certain criteria. Most jurisdictions (45 out of 52) test inmates if they have HIV-related symptoms or if the inmates request a test. Twenty-four States test inmates after they are involved in an incident, and 15 States test inmates who belong to specific "high-risk groups."
*******************************************
Testing policy Number of jurisdictions
-------------- ------------------------
Upon inmate request 40
Upon clinical
indication ofneed 39
Upon involvement
in an incident 24
All incoming inmates 16
High-risk groups 15
All inmates at time
of release 4
Random sample 3
All inmates currently
in custody 3
--------------------------------------------
Note: Detail adds to more than 52 because a jurisdiction may have more than one policy.
*********************************************
HIV infection of local jail inmates
*************************************
At midyear 1993, when the last national census of local jails
was conducted, 1.8% of the inmates were known to be HIV
positive. Among jails reporting data, a total of 6,711 inmates
were HIV positive and 1,888 had confirmed AIDS.
1993 Census of Jails
------------------------
Number HIV/AIDS as Size of HIV a percent of
jurisdictiona positiveb jail inmates
--------------------------------------------
Total 6,711 1.8%
50 largest 3,926 2.9
500 or more 1,374 1.6
250-499 490 1.2
100-249 470 1.0
Fewer than 100 451 .8
--------------------------------------------
aBased on the average daily population between July 1, 1992, and June 30, 1993.
bExcludes inmates in facilities that did not report data.
Source: HIV in Prisons and Jails, 1993.
*******************************************
The infection rate was highest in the largest jail jurisdictions. Almost 3% of the inmates in the Nation's largest jurisdictions were reported to be HIV positive. Among the remaining jurisdictions, the larger the size, the greater the percentage of inmates with HIV/ AIDS. In jurisdictions with 500 or more inmates, 1.6% were infected; in jurisdictions with 250 to 499 inmates, 1.2% of the inmates; and in jurisdictions holding fewer than 250 inmates, 1% or less of the inmates.
***************************************
HIV test results for local jail inmates, by inmate characteristic
****************************************
More detailed data, based on interviews of a national sample of inmates in local jails, are available from the 1995-96 Survey of Inmates in Local Jails. Conducted between October 1995 and March 1996, the survey provides national estimates of the numbers of jail inmates tested for HIV/AIDS and the percent HIV positive.
An estimated 62% of all respondents in the survey said they had ever been tested for HIV. Of those who had been tested and reported HIV test results (289,991), 2.2% said they were HIV positive. Among men, 2.1% said they were HIV positive; among women, 2.4%. An estimated 2.6% of black non-Hispanic inmates, compared to 1.4% of white non-Hispanic inmates, said they tested HIV positive.
******************************************
Table 7. Local jail inmates ever tested for the human immunodeficiency virus and results, by selected characteristics, 1995-96
1995-96 Survey of Local Jail Inmates
---------------------------------------------
Tested inmates who reported results
All inmates 61.5 289991 2.2
Sex
Male 62.1 258019 2.1
Female 68.6 31972 2.4
Race/Hispanic origin
White non-Hispanic 62.4 110023 1.4
Male 62.0 98745 1.3
Female 65.7 11278 2.1
Black non-Hispanic 67.2 125259 2.6
Male 66.3 110453 2.5
Female 74.5 14806 3.2
Hispanic 55.1 45759 3.2
Male 53.9 40985 3.5
Female 67.6 4774 1.3
Other 55.3 8950 0
Age
24 or younger 57.6 81228 0.7
25-34 66.9 116532 2.1
35-44 64.4 70776 3.8
45 or older 57.8 21455 3
Marital status
Married 62.3 45890 1.4
Widowed/divorced 61.4 48695 3
Separated 64.7 25929 2.1
Never married 62.9 169270 2.1
Education
Less than high school 57.8 121589 2.3
GED 68.8 45431 1.3
High school graduate
or more 66.5 122597 2.3
*******************************************
Among male inmates, black non-Hispanics (66%) were more likely
to have been tested for HIV than white non-Hispanics (62%) and
Hispanics (54%). Among those tested, black male inmates (2.5%)
were nearly twice as likely as white male inmates (1.3%) to
report being HIV positive.
Among female inmates, black non-Hispanics (75%) were also more
likely to have ever been tested for HIV than white non-Hispanics
(66%). Although the percent who said they were HIV positive was
higher among black females than white or Hispanic female
inmates, the differences were not statistically significant.
(See Methodology for sample design and accuracy of the survey
methods.)
Inmates in the age groups 25 to 34 and 35 to 44 were more likely
to report having been tested for HIV than inmates in other age
groups. Inmates age 24 or younger had the lowest rates of HIV
positive (0.7%), while those 35 to 44 had the highest rates
(3.8%).
Inmates with a GED (69%) and those who completed high school
(67%) were more likely to have ever been tested for HIV than
inmates who had not completed high school (58%). Inmates who
had completed high school were as likely as those who had not
completed high school to say they tested HIV positive (2.3%).
****************************************
Percent HIV positive among jail inmates, by offense and prior drug use
****************************************
Among jail inmates who said they had been tested for HIV/AIDS, those held for drug offenses were the most likely to be HIV positive (3.3%). Drug offenders were twice as likely as violent offenders (1.5%) to report that they tested positive for HIV.
property and public-order offenders reported somewhat lower rates--2.2% and 1.7%, respectively.
The percentage of jail inmates reporting that they were HIV positive varied by level of prior drug use. An estimated 2.3% of inmates who had ever used drugs, 3.0% of convicted inmates who used drugs in the month before their current offense, 4.0% of inmates who said they had used needles to inject drugs, and 6.3% of those who had shared a needle with someone else were HIV positive.
****************************************
Table 8. Local jail inmates testing HIV positive, by offense
and prior drug use, 1995-96
1995-96 Survey of Inmates in Local Jails
-----------------------------------------------
Tested inmates who
All jail inmates reported results
-------------------- ------------------------
Percent Percent
Characteristic Number ever tested Number HIV positive
---------------------------------------------------------------------------------
Current offense/a
Violent 130583 61.5 72846 1.5
Property 133513 66.3 79936 2.2
Drug 109180 65.7 65780 3.3
Public-order 120882 57.6 64820 1.7
Prior drug use/b
Never used 88553 52.3 42242 1.6
Ever used 413285 65.0 247233 2.3
Used month before offense/c 172840 67.4 107900 3.0
Used needle to inject drugs/d 85622 77.6 61862 4.0
Shared a needlee 34850 78.6 25476 6.3
---------------------------------------------------------------------------------
/aExcludes jail inmates whose offense was unknown.
/bInmates were asked a detailed set of questions about past use of illegal drugs.
These drugs included marijuana, barbiturates, methaqualone, tranquilizers
(without a doctor's prescription), methamphetamine, other amphetamines, crack,
cocaine other than crack, heroin, other opiates, PCP, LSD, inhaled or sniffed
substances, and other drugs.
/cInmates who were unconvicted (awaiting arraignment, awaiting trial or on trial)
were not asked any questions about drug use during the month before the arrest for
which they were currently detained.
/dAll inmates who reported prior drug use were asked: "Have you ever used a
needle to get any drug injected under your skin, into a muscle or into a vein
for non-medical reasons?"
/eInmates who reported ever using a needle to inject drugs were asked:
"Have you ever used a needle that you knew or suspected had been used
by someone else for injecting drugs or shared a needle that you had used with someone else?"